New Conversation
Simply adds up all monthly payments from your claiming age until life expectancy.
Example: Claim at 62, get $1,400/month for 28 years = $470,400 total
Does not account for inflation or time value of money - treats a dollar today the same as a dollar 20 years from now.
Discounts future payments back to their present-day value using a discount rate (typically 3%).
Why it matters: Future money is worth less than today's money due to opportunity cost and inflation.
All benefits are converted to their equivalent value at age 62, making different claiming strategies directly comparable.
Assumes you invest all benefits as you receive them and shows total compounded wealth at life expectancy.
Example: Claim at 62 and invest at 5% return → benefits grow to ~$1.3M by age 90
Helps answer: "Is it better to claim early and invest, or wait for higher monthly payments?"
Here's how Strategy # compares to your current plan:
How would you like to save this strategy?
Explore example scenarios
These plans are intentionally sub-optimal. Use the Run Analyzer and Run Optimization buttons throughout the app — and the Full Strategy Optimizer — to discover how much they can be improved. Nothing is saved.
Subscribe to continue planning your retirement with Prisma.
WHAT'S INCLUDED
Cancel anytime. No commitment required.
What this means
If you accept, all your plans will be shared with your advisor and you won't be able to create private plans. Your advisor can view and edit shared plans.
Your initial retirement plan is up and running! Here's what you can explore now and how to get even more from it.
The Full Strategy Optimizer simultaneously evaluates thousands of combinations — Social Security claiming age, Withdrawal order, and Roth conversion amounts — to find the single best strategy for your specific situation.
Reopen this guide anytime via the book_5 book icon in the header. Use the route Guide Me button to access the guided workflow anytime.
Gather these before you start — the whole setup takes about 5 minutes.
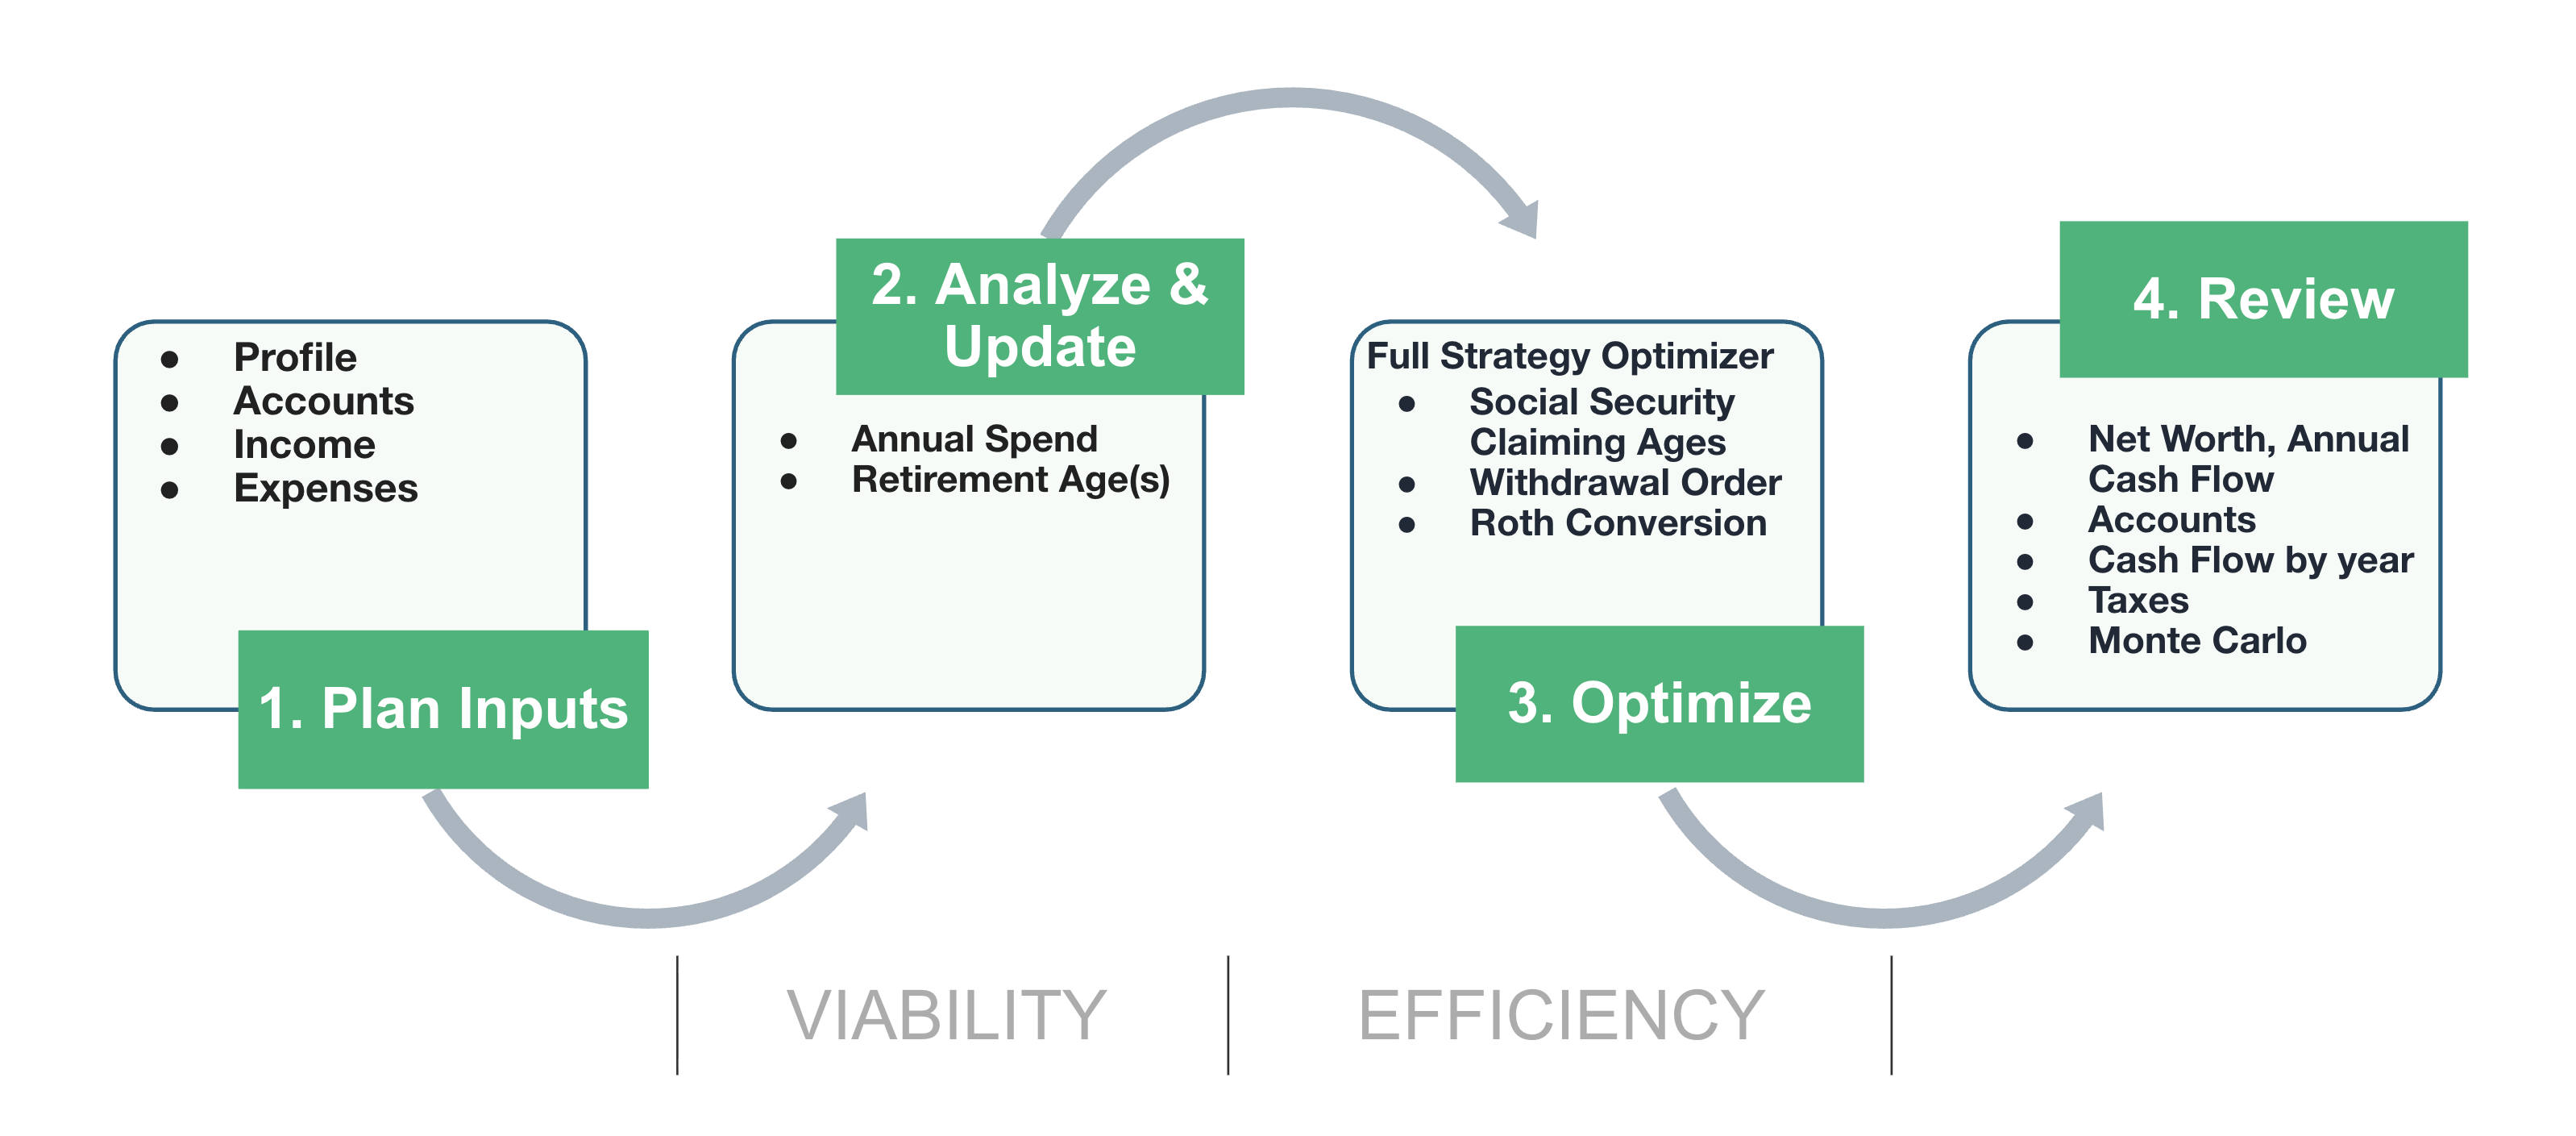
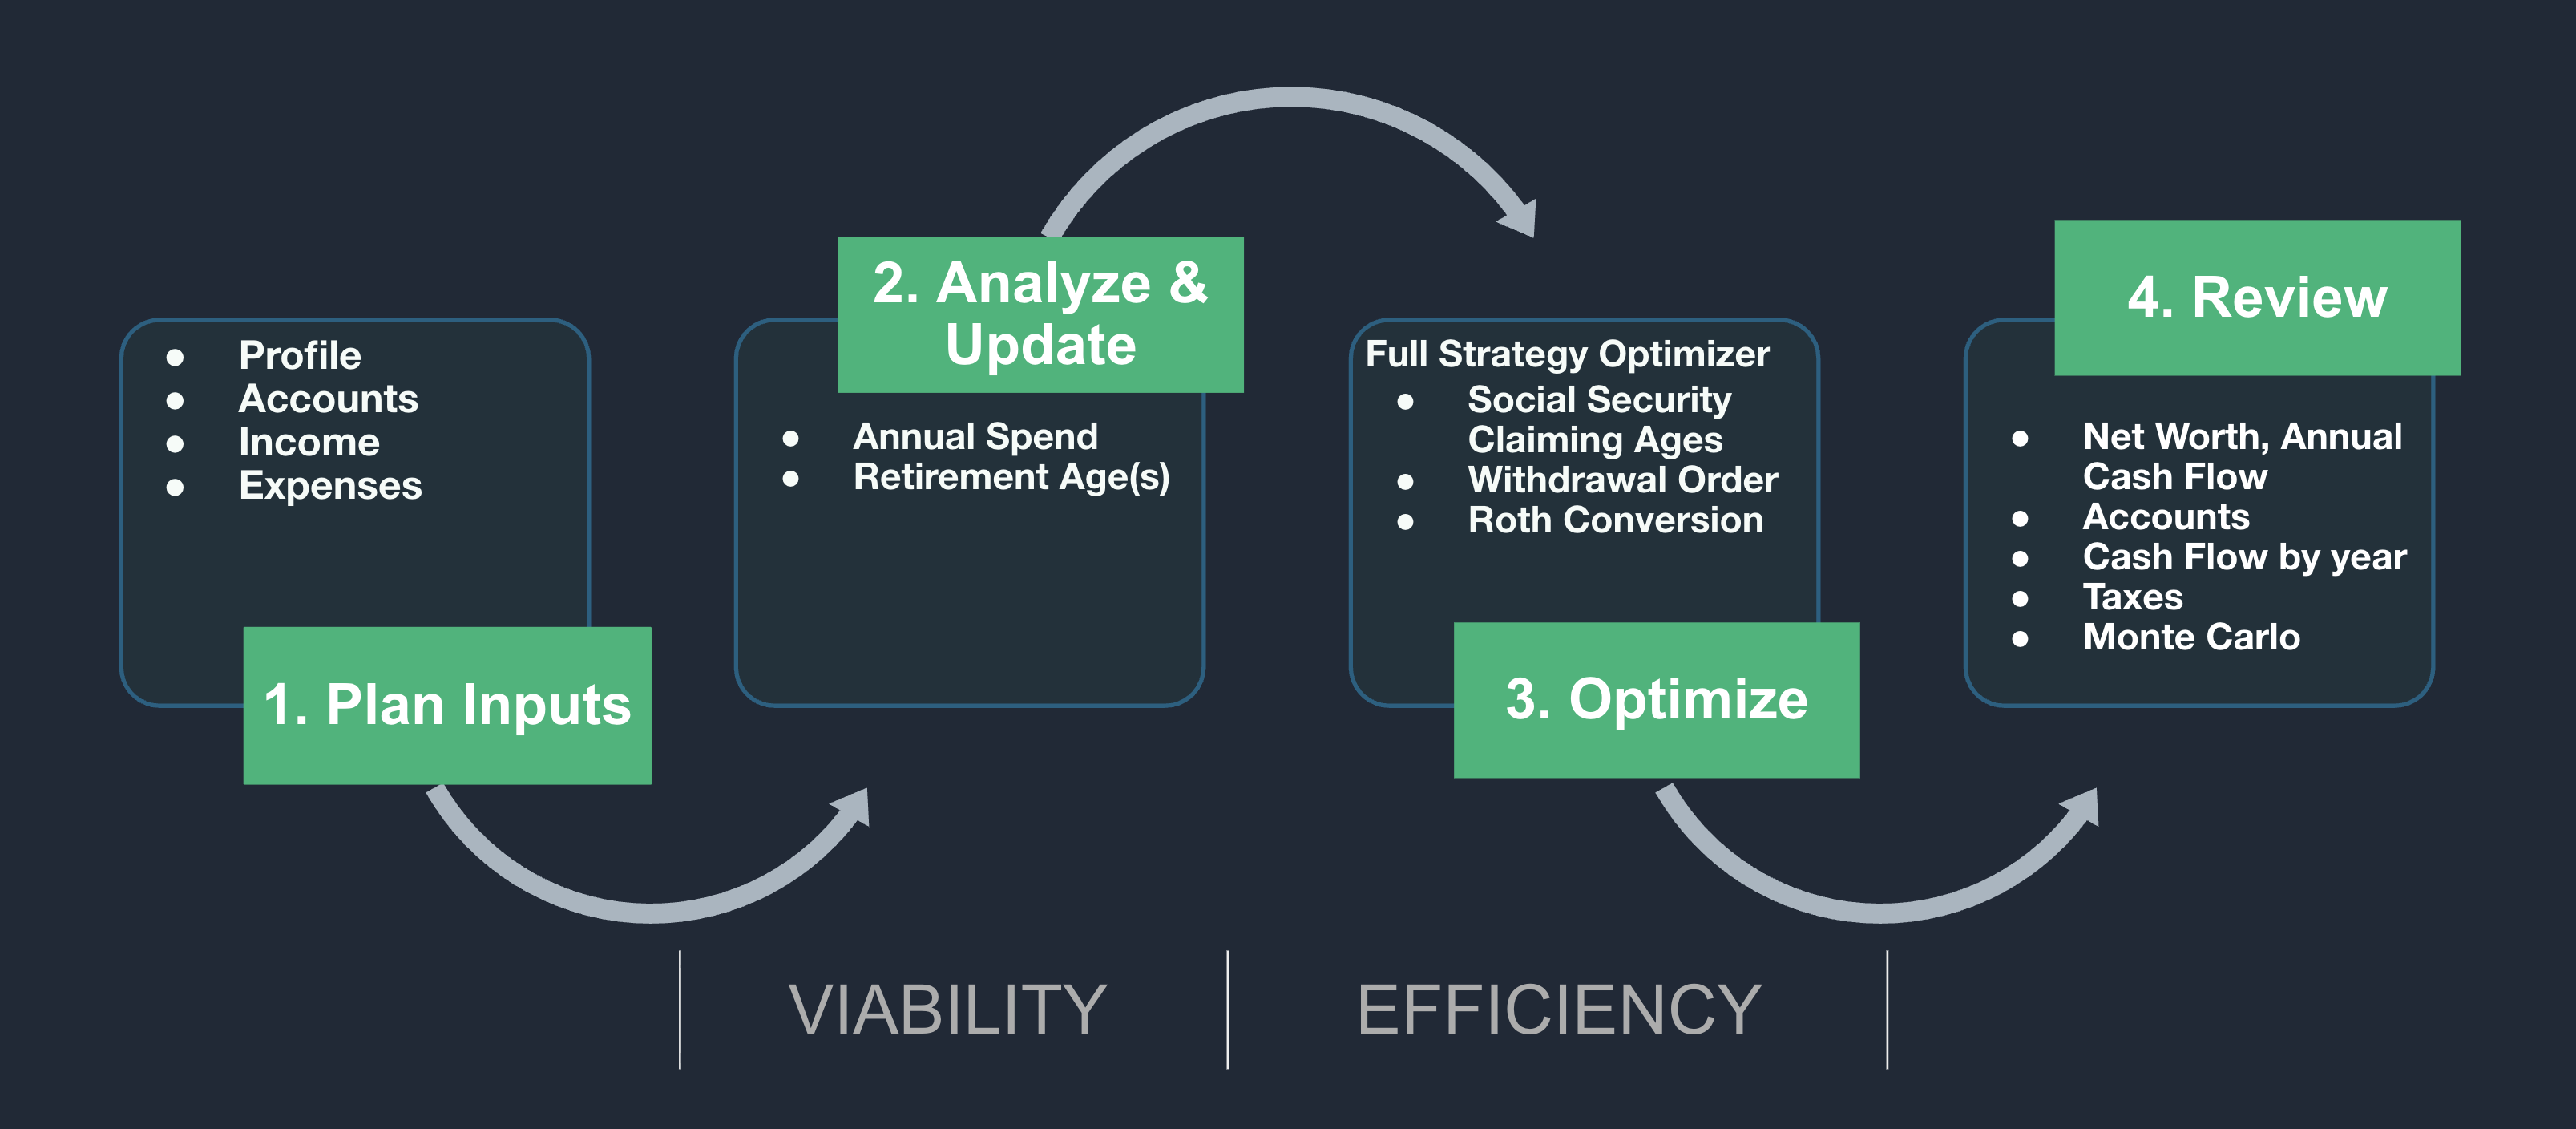
Prisma works best when you follow a structured workflow: enter your financial details, analyze safe spending amount and retirement age, then let the optimizer find the best strategy for Social Security, Withdrawals, and Roth conversions. Click on the Guide Me button to get started.
The workflow is structured deliberately: spending amount and retirement age determine whether your plan is viable — a probabilistic question Monte Carlo simulation is designed to answer. Once those are set, Prisma's Full Strategy Optimizer runs an exhaustive search to find the most efficient strategy within a viable plan. This covers Social Security timing, Withdrawal order, and Roth conversions. Here's how to move through each phase.
In Plan Inputs, enter everything Prisma needs to build an accurate projection:
Projections update automatically as you enter data — no button to press.
Monte Carlo simulation stress-tests your plan across hundreds of randomized market scenarios. Use these tools to find inputs where your plan succeeds in at least 90% of scenarios:
Update your plan with the selected annual spending amount and retirement age before moving on.
With spending and retirement age locked in, run the Full Strategy Optimizer. It searches across thousands of combinations in three dimensions:
The Full Strategy Optimizer simultaneously evaluates thousands of combinations — Social Security claiming age, Withdrawal order, and Roth conversion amounts — to find the single best strategy for your specific situation.
Pick the strategy that fits your priorities, then save the new plan.
After saving your optimized plan, dive into the year-by-year projections to understand how the strategy plays out: